

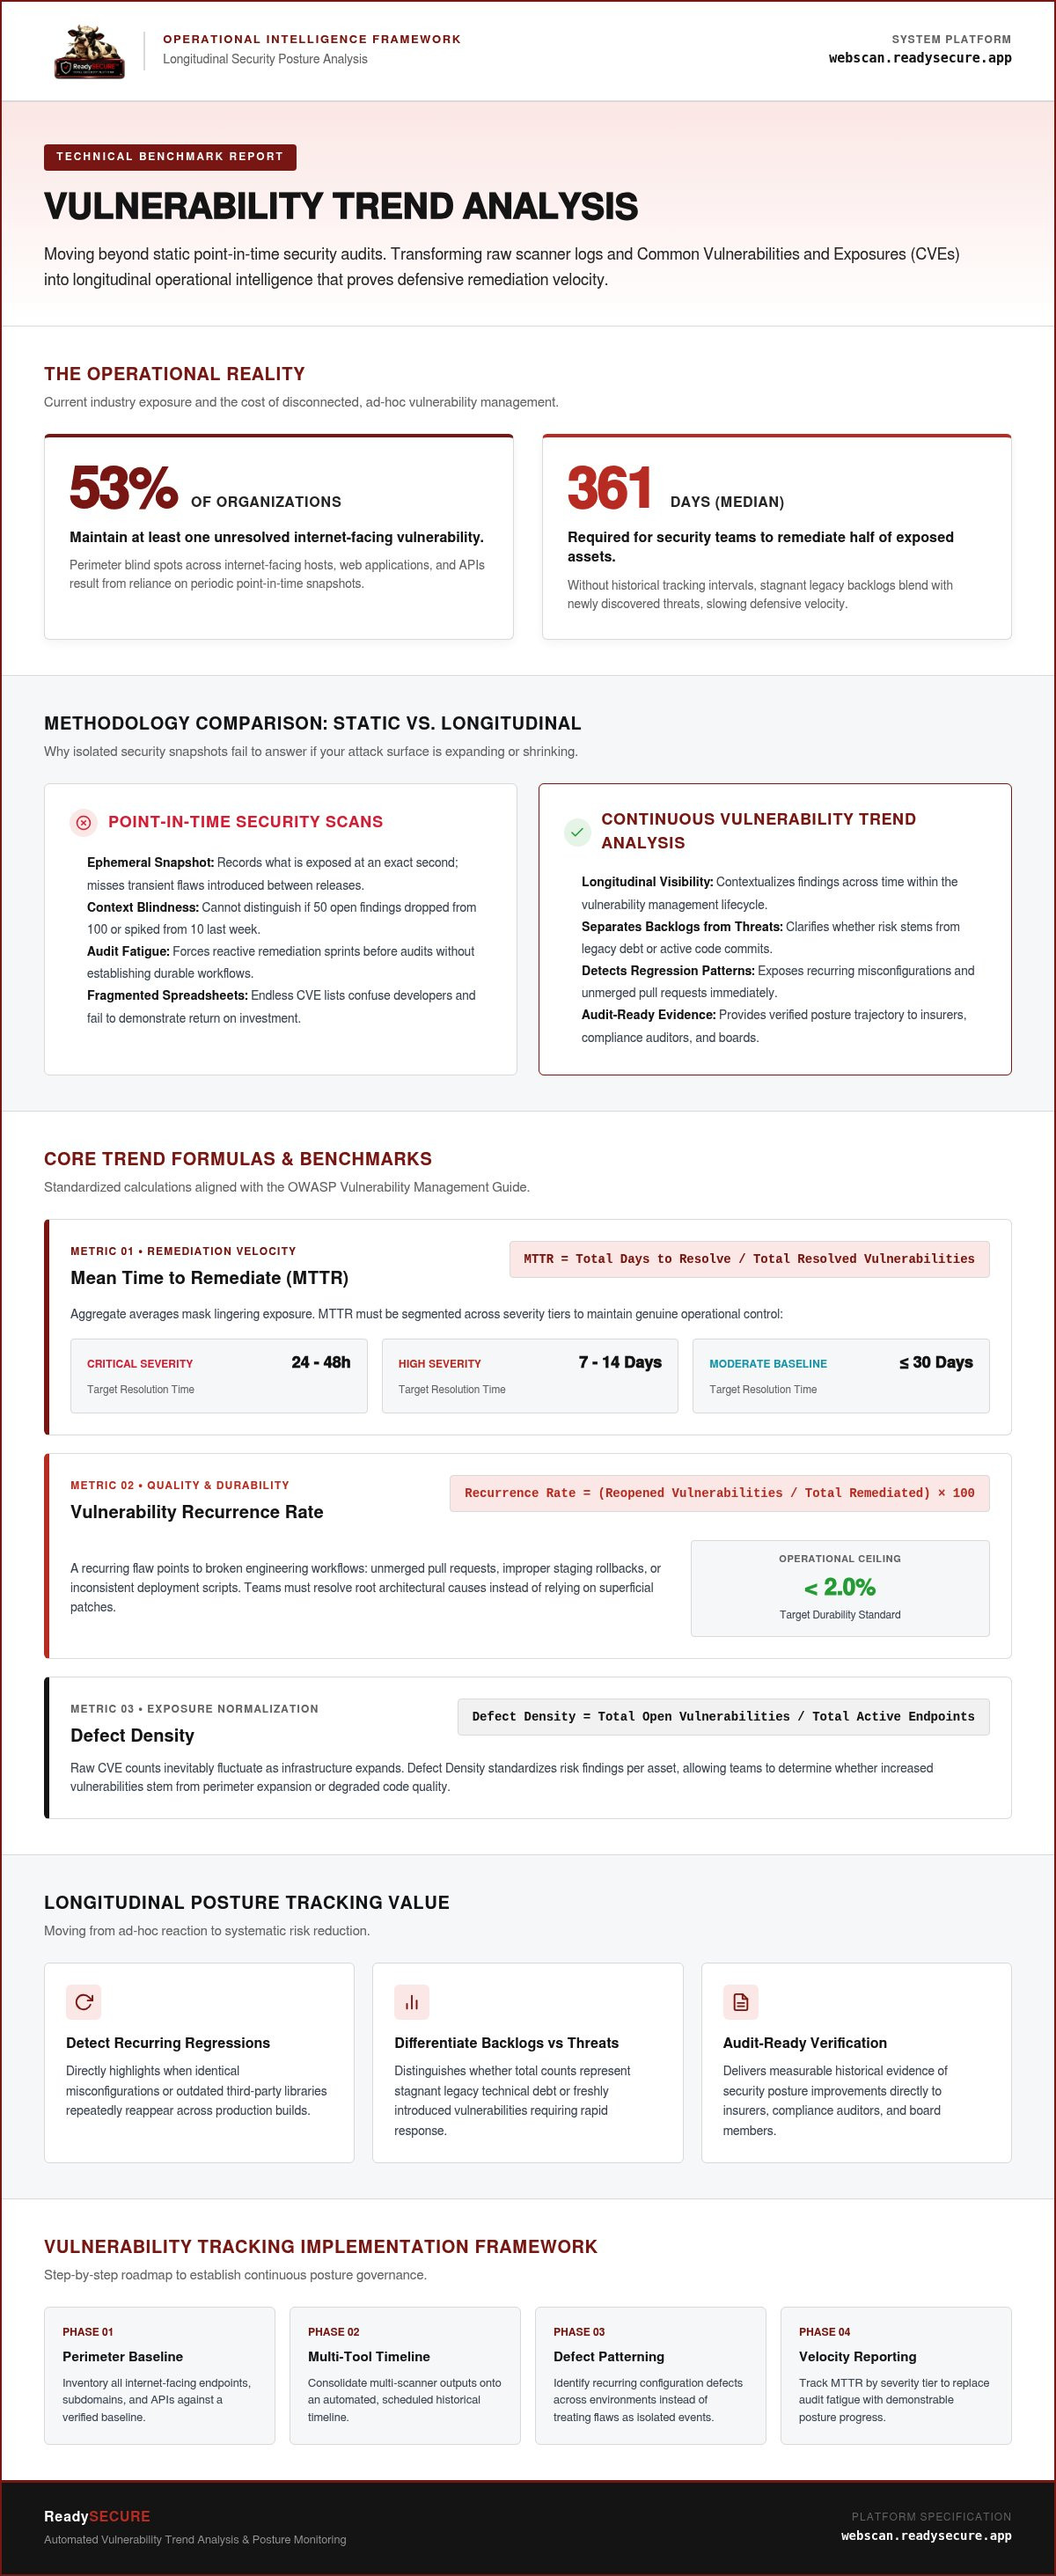
Industry research reveals that 53% of organizations maintain at least one unresolved internet-facing vulnerability, with teams taking a median of 361 days to remediate half of their exposed assets. When security reporting relies solely on point-in-time snapshots, measuring real progress becomes nearly impossible. Implementing continuous vulnerability trend analysis bridges this gap by turning raw, momentary scan results into verifiable operational intelligence.
You already know the frustration of audit fatigue. Endless spreadsheets of Common Vulnerabilities and Exposures confuse developers and fail to show executive leadership the return on defensive investments. In this guide, you will learn how to transform isolated vulnerability scan outputs into historical trend metrics that prove security posture improvements. We explore how to establish core benchmarks like Mean Time to Remediate, correlate findings across multi-tool scanning intervals, and build clear progress dashboards that satisfy both auditors and board members.
Key Takeaways
- Shift from static, point-in-time scanning to vulnerability trend analysis to evaluate how your security posture evolves over time.
- Establish actionable metrics like Mean Time to Remediate (MTTR) broken down by severity level to track true remediation velocity.
- Build a repeatable tracking framework by inventorying internet-facing endpoints, subdomains, and APIs against a verified baseline.
- Identify recurring configuration defects across deployment environments instead of treating repeated flaws as isolated occurrences.
- Replace fragmented spreadsheets by consolidating multi-scanner findings onto an automated, scheduled historical timeline.
What Is Vulnerability Trend Analysis and Why Does It Matter?
How do you confirm whether your attack surface is shrinking or expanding? A single scan delivers an immediate ledger of flaws, but it cannot answer that fundamental question. Vulnerability trend analysis is the disciplined practice of tracking discovered, open, and remediated security findings across time. Instead of viewing security as a static checklist, this method contextualizes exposures within the broader vulnerability management lifecycle. It connects point-in-time scan data to operational outcomes, proving whether defensive remediation actually keeps pace with emerging risks.
Without historical tracking, security teams operate in the dark. An isolated report showing fifty open findings might feel alarming, but context dictates the response. Did those fifty vulnerabilities drop from one hundred last month, or did they spike from ten last week? Longitudinal visibility prevents blind spots across internet-facing hosts, web applications, and APIs, halting the creeping technical debt that leaves organizations exposed.
The Limitations of Point-in-Time Security Scans
Single-point scans provide an ephemeral snapshot of an active attack surface. They record what is exposed at an exact second, but cloud environments, codebases, and configurations change constantly. Ad-hoc testing intervals miss transient weaknesses introduced during intermediate software releases. This dynamic forces teams into reactive, exhausting remediation sprints before every compliance audit, burning out engineers without establishing repeatable security practices.
The Strategic Value of Longitudinal Posture Tracking
Longitudinal analysis replaces guesswork with verifiable data. It helps organizations separate normal operational turnover from deeper systemic flaws:
- Detects recurring regressions: Highlights when identical misconfigurations or outdated libraries repeatedly reappear in production builds.
- Differentiates backlogs from new threats: Distinguishes whether total CVE counts represent stagnant legacy backlogs or newly introduced vulnerabilities.
- Provides audit-ready verification: Delivers measurable evidence of security posture improvements to insurers, compliance auditors, and executive leadership.
Evaluating historical direction turns fragmented vulnerability alerts into clear operational roadmaps. You stop reacting to individual findings and start managing systemic risk.
Key Metrics and Formulas for Measuring Vulnerability Trends
How do engineering leads quantify real security momentum without getting lost in mathematical abstraction? You don't need complex probability curves to assess your digital perimeter. Transparent, reliable vulnerability trend analysis relies on simple formulas that track operational speed, patch durability, and total exposure over time. Aligning these indicators with the OWASP Vulnerability Management Guide provides a repeatable framework for measuring real defensive progress.
Remediation Velocity: Mean Time to Remediate (MTTR)
Mean Time to Remediate calculates the average duration between vulnerability discovery and verified patch deployment:
MTTR = Total Days to Resolve Detected Vulnerabilities / Total Resolved Vulnerabilities
Tracking MTTR in aggregate hides critical risks. A 14-day overall average looks clean, but it can mask critical flaws lingering for months. Segment MTTR across severity tiers to maintain operational control. Strive to resolve critical weaknesses within 24 to 48 hours, high-severity flaws within 7 to 14 days, and moderate baseline issues within 30 days.
Measuring Flaw Recurrence and Vulnerability Reopening Rates
Patching a defect once means nothing if it resurfaces in the next production push. The Vulnerability Recurrence Rate measures how often resolved flaws reappear during automated scan cycles:
Recurrence Rate = (Reopened Vulnerabilities / Total Remediated Vulnerabilities) × 100
A recurring flaw points directly to broken engineering workflows. Common causes include unmerged pull requests, improper staging rollbacks, or inconsistent deployment scripts. Keep this rate below 2% to ensure engineering teams resolve root causes instead of applying superficial temporary patches.
Net Attack Surface Exposure and Defect Density
Raw CVE counts fluctuate as your digital infrastructure grows. Defect Density standardizes your findings by calculating open issues per active internet-facing asset:
Defect Density = Total Open Vulnerabilities / Total Active Endpoints
Pairing this metric with exposure windows shows the precise duration assets remain unprotected. Tracking density ensures an expanding asset inventory doesn't falsely signal defensive failure. For continuous visibility into your current baseline exposure, you can run a targeted check with a ReadySECURE Free Scan to establish your starting numbers.
How to Build an Actionable Vulnerability Tracking Framework
How do engineering teams construct a reliable measurement framework without getting trapped in manual spreadsheets? Shifting to automated vulnerability trend analysis demands a structured process. You must catalog external targets, lock in baseline exposures, enforce consistent scanning cycles, and consolidate findings across specialized tools.
Establishing an Accurate Security Baseline
You cannot measure operational improvement without a clear starting point. Begin by inventorying all internet-facing domains, APIs, web hosts, and public network subnets. Pair every external target with verified testing authorization before running scans to guarantee complete regulatory and legal compliance. Once authorized, execute an exhaustive initial assessment to catalog active services, open ports, and legacy CVEs. Document these baseline totals by severity tier to benchmark future remediation efforts accurately.
Aligning Scan Schedules with Deployment Lifecycles
Sporadic scans produce noisy, fragmented data that obscures real remediation velocity. Consistent execution is essential for valid mathematical trends. Determine scanning frequency by evaluating software release velocity alongside asset criticality. High-traffic web applications and production APIs benefit from weekly automated cycles, while deep architectural network assessments can run monthly. Establishing dependable cadences bridges short-term development changes with long-term defensive oversight, aligning directly with continuous vulnerability scanning principles and best practices for scheduled network security scans.
Normalizing Data Across Disparate Scanning Engines
No single scanning engine catches every exposure category. Robust security architectures rely on specialized scanners targeting distinct layers of the technology stack:
- Host and Port Discovery: Nmap maps open network ports and exposed service listeners.
- Network Vulnerabilities: OpenVAS evaluates unpatched operating systems and infrastructure flaws.
- Web Applications and APIs: ZAP performs active and passive scanning against dynamic application endpoints.
- Transport Layer Security: TestSSL identifies outdated cryptographic protocols and certificate flaws.
- Targeted Misconfigurations: Nuclei flags known CVE signatures and zero-day exposures using fast template engines.
Consolidating these tools manually inside spreadsheets causes duplicate findings, inconsistent naming, and alert fatigue. Solve this by mapping discovered issues to standardized Common Vulnerabilities and Exposures (CVE) entries and Common Weakness Enumeration (CWE) categories. Normalized reporting gives teams a single, coherent timeline of perimeter health across all assessment layers.
Interpreting Trends to Fix Systemic Flaws and Reduce Backlogs
How do engineering teams turn historical data into actionable remediation workflows? Collecting metrics is useless if the outputs merely sit inside unattended repositories. Rigorous vulnerability trend analysis empowers teams to diagnose the root causes of security defects, prioritize engineering backlogs pragmatically, and translate technical progress into language executive stakeholders understand.
Distinguishing Environmental Drift from Code Deficiencies
Trend spikes reveal the true origin of perimeter exposure. When a sudden upward curve appears in your historical charts, evaluate the underlying trigger:
- Infrastructure and Configuration Shifts: Abrupt discoveries of exposed administrative ports, expired TLS certificates, or permissive firewall rules point directly to operational drift or faulty deployment scripts.
- Application Code Deficiencies: Gradual climbs in cross-site scripting, injection vulnerabilities, or authentication flaws signal insecure coding patterns introduced during regular development sprints.
If an identical misconfiguration surfaces simultaneously across multiple staging and production subdomains, treat it as a centralized configuration defect. Fixing the baseline deployment script resolves the exposure across every host at once, eliminating repetitive remediation tickets.
Prioritizing Vulnerability Backlogs Without Paralyzing Developers
Dumping raw scan outputs onto software engineers causes immediate alert fatigue and stalls feature development. Historical trend metrics provide an objective prioritization mechanism. Establish formal Service Level Agreements (SLAs) anchored to verified MTTR thresholds rather than panic-driven sprints. Direct sprint allocations toward critical persistent vulnerabilities that exceed their resolution window, while batching moderate, stable findings into routine maintenance cycles. This approach keeps development velocity predictable while systematically trimming back legacy debt.
Reporting Progress to Executive Leadership and Compliance Auditors
Board members and compliance auditors don't need lists of raw CVE numbers. They want verifiable proof of operational resilience. Historical tracking converts granular scanner findings into clear risk reduction curves that showcase improving remediation velocity. Pairing long-term trend lines with signed testing authorizations creates an immutable audit trail, validating that security investments actively reduce digital exposure over time.
To eliminate manual spreadsheet compilation and gain clear visibility into your perimeter health, start tracking your exposure with ReadySECURE Paid Plans.
Automating Vulnerability Trend Analysis with ReadySECURE
Why do security engineers waste hours aggregating CSV exports when they could be resolving active exposures? Manually reconciling findings from separate open-source tools consumes valuable development time and introduces human error. ReadySECURE eliminates this friction by automating execution and synthesizing disparate findings into a continuous timeline. Adopting modern automated vulnerability scanning transforms fragmented data collection into a hands-off, dependable operational workflow.
Multi-Scanner Historical Aggregation
Comprehensive security visibility requires examining your perimeter from multiple specialized vantage points. ReadySECURE coordinates six industry-standard scanning tools across your authorized web assets:
- Port and Service Mapping: Nmap Port Scanning pinpoints active listening services and perimeter changes.
- Infrastructure Flaw Detection: OpenVAS Network Scanning audits host configurations and unpatched packages.
- Web and API Defense: ZAP Active and Passive Scanning checks dynamic web targets for code-level weaknesses.
- Encryption Verification: TestSSL Inspection flags outdated cipher suites and expiring certificates.
- Targeted Signature Auditing: Nuclei Template-Based Scanning evaluates zero-day exposures and critical bug signatures.
Instead of managing isolated reporting streams, ReadySECURE Paid Plans automatically stitch these disparate outputs into a unified historical ledger. You can observe your security posture quarter over quarter, confirming whether newly applied patches hold or if old vulnerabilities reemerge under modern configurations.
Verifiable Compliance and Authorized Trend Records
Compliance auditors and cyber insurance assessors require strict proof of operational governance. ReadySECURE pairs every automated scan run directly with a signed legal authorization record. This verification confirms that every probe across your external domains, APIs, and network endpoints occurred with full explicit permission.
Historical reporting timelines produce verifiable remediation records. You can instantly generate trend charts that prove falling exposure curves and tighter resolution intervals to executive leadership. You don't have to overhaul your entire security workflow on day one. Establish your initial baseline and evaluate your external exposure today with a ReadySECURE Free Scan.
Transform Point-in-Time Scans into Lasting Security Momentum
Tracking exposures across time turns isolated security alerts into measurable operational improvements. When you calculate MTTR by severity tier and monitor defect density across consistent scan intervals, engineering backlogs become manageable rather than paralyzing. You gain the objective clarity needed to eliminate systemic flaws before attackers can exploit them.
Automated vulnerability trend analysis eliminates spreadsheet overhead by uniting six open-source engines, including ZAP, OpenVAS, and Nuclei, into a single chronological timeline. With signed authorization documentation attached directly to every scan record, your historical progress remains legally sound and verifiable to compliance auditors and executive leadership.
Ready to see where your external perimeter stands? Run a ReadySECURE Free Scan to establish your initial vulnerability baseline today. You can then adopt ReadySECURE Paid Plans when your team requires scheduled tracking and continuous historical reporting. Strengthening digital defenses doesn't happen overnight, but disciplined measurement ensures every remediation effort moves your security posture forward.
Frequently Asked Questions
What is the primary difference between a vulnerability scan and vulnerability trend analysis?
A vulnerability scan captures a static snapshot of security exposures at a single moment, whereas vulnerability trend analysis tracks findings over time to measure remediation velocity and systemic health. While an isolated scan reveals what is open today, trend tracking establishes whether your exposure is growing or shrinking across release cycles. It converts disjointed CVE alerts into historical metrics like flaw half-life and resolution rates.
How frequently should our organization run scans to produce meaningful vulnerability trend analysis?
Organizations should run scans on a weekly schedule for dynamic web applications and APIs, and at least monthly for broader external network infrastructure. Consistent intervals are critical to generating mathematically reliable vulnerability trend analysis. Running scans sporadically creates temporal gaps that distort MTTR calculations and obscure when regressions entered production. Scheduled scans establish predictable data points aligned with deployment cadences.
Which core metrics are most essential when tracking vulnerability remediation trends?
The most essential metrics are Mean Time to Remediate (MTTR) segmented by severity tier, Defect Density, and the Vulnerability Recurrence Rate. MTTR highlights operational velocity, revealing whether high-severity issues resolve within defined SLAs. Defect density normalizes vulnerability counts against your active endpoint count, preventing false alarms as your digital perimeter expands. Recurrence tracking measures patch durability and code stability over successive builds.
How do we handle false positives so they do not distort our historical trend data?
You handle false positives by validating them with secondary scanning engines and recording audited suppression exceptions with formal administrative sign-off. Leaving unverified false positives in scan histories artificially inflates vulnerability backlogs and skews MTTR figures. Documenting verified exclusions ensures that future scan cycles ignore known benign alerts while maintaining an audit trail. This filtering protects data integrity without compromising perimeter visibility.
Can vulnerability trend analysis track configuration drift across internet-facing APIs?
Yes, longitudinal tracking identifies configuration drift across APIs by monitoring recurring environmental attributes like SSL/TLS cipher states, authentication headers, and open listening ports. When automated scans evaluate public API gateways on a recurring schedule, sudden changes in exposed endpoints or protocol versions immediately stand out. Comparing current telemetry against your baseline reveals whether misconfigurations stem from infrastructure modifications or code releases.
What causes vulnerability recurrence rates to spike across recurring scan cycles?
Spikes in vulnerability recurrence rates are usually caused by flawed deployment pipelines, unmerged bug fixes in source repositories, or infrastructure rollbacks. When a developer patches an issue in one environment without merging the fix upstream, subsequent releases inadvertently reintroduce the vulnerability. Staging drift and configuration overrides across server clusters also cause resolved flaws to reopen, signaling a breakdown in change management procedures.
How does multi-engine vulnerability scanning improve the accuracy of historical trend reports?
Multi-engine scanning improves trend accuracy by eliminating blind spots across specialized layers of the technology stack. A single tool cannot thoroughly evaluate ports, network daemons, dynamic web application logic, and TLS configurations simultaneously. Running specialized tools like Nmap, OpenVAS, ZAP, TestSSL, and Nuclei provides complementary coverage. Consolidating their outputs creates a balanced historical trend line that reflects your entire attack surface.


